Everything Is a Graph (And You Already Know How They Work)
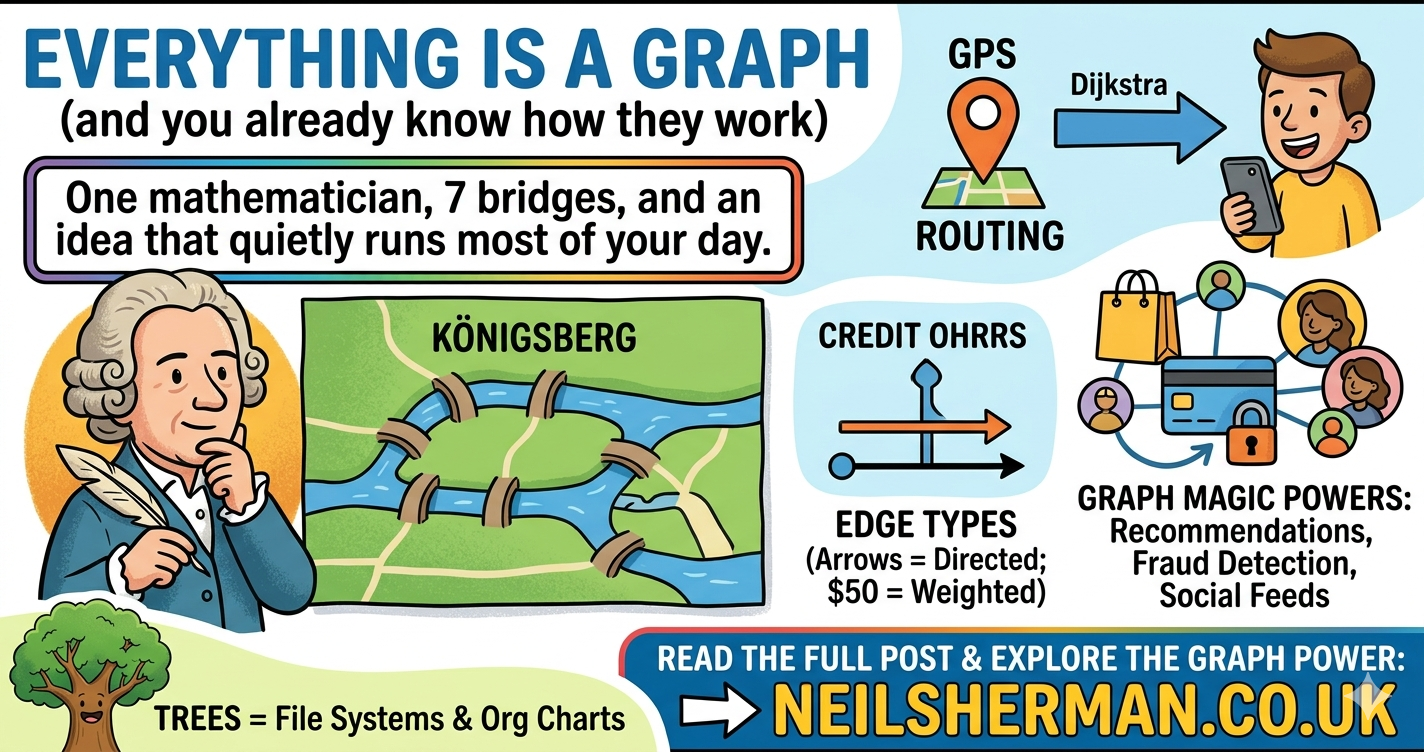
One mathematician, seven bridges, and an idea that quietly runs most of your day.
In 1736, a Swiss mathematician called Leonhard Euler was looking at a map of Königsberg. The city sat across both banks of a river with two islands in the middle, all stitched together by seven bridges. The locals had a question that wouldn’t go away: could you take a walk that crossed every bridge exactly once and ended up back where you started?
Euler proved you couldn’t. The more important thing he proved is that you couldn’t for any arrangement of land and bridges with that shape. Königsberg itself was almost beside the point. What interested him was the structure underneath it.
The paper accidentally invented graph theory, which now sits underneath GPS routing, recommendation engines, fraud detection, your social feeds, and most of the software you used before lunch.
So what’s a graph?
The definition is genuinely tiny:
A graph is a set of things, and a set of connections between those things.
The things are called vertices, or nodes. The connections are called edges. The trick is that vertices and edges can represent almost anything. Cities and roads. People and friendships. Web pages and hyperlinks. Train stations and rail lines. Microservices and API calls. Ingredients and “goes well with”. The moment you decide what your dots and lines mean, every result graph theory has ever proven becomes available to you for free.
The same maths that told Euler’s walkers to give up is structurally identical to the maths Google uses to rank web pages. The vertices and edges change, the theorems don’t.
One thing that trips people up. “Graph” in this sense has nothing to do with bar charts or scatter plots. The word comes from Greek and means drawing. If your mind goes to Excel, that’s an entirely different thing called a chart. Mathematicians and spreadsheet users have been talking past each other on this for about two hundred years, with no real sign of either side budging.
Three flavours of edge
Not all connections behave the same way, and most of the practical questions in graph theory come down to which flavour of edge you’ve got.
If the connection goes both ways, you’ve got an undirected edge. A friendship. A road you can drive in either direction. If it only goes one way, it’s directed, and you draw it with an arrow. Twitter follows. One-way streets. The order of stages in a build pipeline. And if the connection carries a number alongside it, a distance or cost or time or probability, the edge is weighted.
As soon as you weight your edges, the questions get more interesting. It stops being “is there a path from A to B” and becomes “what’s the best path from A to B”.
That’s the question Edsger Dijkstra answered in 1956. He was sitting on a cafe terrace in
Amsterdam with his fiancee, with no pencil and no paper, thinking about how to demonstrate a new
computer to a non-technical audience. He worked the algorithm out in his head and later called it
“a twenty-minute invention”. It now powers almost every navigation system on earth,
which is a decent return on a coffee. Dijkstra went on to write a short piece arguing that the
GOTO statement should be abolished from programming. He’d titled it “A Case
Against the GO TO Statement”; his editor, Niklaus Wirth, renamed it “Go To Statement
Considered Harmful”, and in doing so accidentally invented a headline format that programmers
have been wearing out ever since.
Trees
A tree is a graph with two rules. It’s connected, meaning you can reach any node from any other. And it has no cycles, meaning you can’t go round in circles. Put those two rules together and exactly one path exists between any two nodes. There is never a second way round.
You’ve been working with trees forever without necessarily naming them. Your file system is a tree. Your company’s org chart is a tree. The DOM in a browser is a tree. The way a compiler parses your code into an Abstract Syntax Tree before turning it into machine instructions is, fittingly, a tree. Even your family tree is a tree, which stops feeling like a coincidence after the third or fourth example.
Trees are everywhere in software because they’re easy. Algorithms on trees are fast and easy to reason about. The moment you allow cycles, life gets noticeably harder.
The naming, incidentally, gives up almost immediately. A collection of trees that aren’t connected to each other is called a forest, which is fine, right up until you picture it.
The Travelling Salesman
A salesman needs to visit a list of cities. He starts at home, visits each city exactly once, and returns home. Given the distances between cities, what’s the shortest possible route?
The answer is: nobody knows, and that turns out to be much more interesting than it sounds.
The number of possible routes grows factorially. Ten cities gives you 181,440. Twenty cities gives you around sixty quadrillion. Thirty cities gives you more routes than there are stars in the observable universe. You are not going to check them one at a time.
What makes it genuinely strange is that nobody has found a clever algorithm that solves it efficiently either, and it is strongly suspected that no such algorithm exists. The question of whether problems like this have efficient solutions is called P versus NP, it has been open since 1971, and the Clay Mathematics Institute will pay one million dollars to whoever settles it. The catch is that proving P equals NP could also break most of modern cryptography, so people who understand the problem tend to have complicated feelings about hoping it gets solved.
In practice, when you ask Google Maps to plan a route through ten stops, it doesn’t find the perfect answer. It finds a very good answer, very fast, using approximations and heuristics, and you get on with your day. The gap between “optimal solution exists somewhere in theory” and “good enough solution arrives before the kettle boils” is where most real engineering happens.
Sample code, because at some point you just want to see it
Here is a problem you almost certainly have encountered. You’ve got a system made of components that depend on each other. Service A calls service B, service B calls service C, and somewhere in the tangle, somebody has accidentally introduced a circular dependency that is going to cause problems at startup, or at deploy, or at 3am.
Modelled as a graph, this is a directed graph with services as vertices and “calls” as directed edges. The question “is there a cycle in here” is a classic graph problem with a classic answer: depth-first search, keeping track of the nodes currently on your path.
import java.util.*;

public class CycleFinder {

    private final Map<String, List<String>> graph = new HashMap<>();

    public void addDependency(String from, String to) {
        graph.computeIfAbsent(from, k -> new ArrayList<>()).add(to);
        graph.putIfAbsent(to, new ArrayList<>());
    }

    public boolean hasCycle() {
        Set<String> visited = new HashSet<>();
        Set<String> onPath = new HashSet<>();
        for (String node : graph.keySet()) {
            if (dfs(node, visited, onPath)) return true;
        }
        return false;
    }

    private boolean dfs(String node, Set<String> visited, Set<String> onPath) {
        if (onPath.contains(node)) return true;   // we have looped back on ourselves
        if (visited.contains(node)) return false; // already cleared this one
        visited.add(node);
        onPath.add(node);
        for (String neighbour : graph.get(node)) {
            if (dfs(neighbour, visited, onPath)) return true;
        }
        onPath.remove(node);
        return false;
    }
}
A quick test:
CycleFinder cf = new CycleFinder();
cf.addDependency("ServiceA", "ServiceB");
cf.addDependency("ServiceB", "ServiceC");
cf.addDependency("ServiceC", "ServiceA"); // here be dragons
System.out.println(cf.hasCycle()); // true
That’s the whole thing. A handful of lines, no clever data structures, and a tool that scales to any size of service graph you feed it. You can extend it to print the offending cycle, point it at a Maven dependency tree, run it across a parsed list of Spring beans, or drop it into a build step.
What matters here is how small the code gets once you’ve recognised the shape. Three quarters of the work was the recognition. The rest was typing.
A few other places this comes up
The pattern of “this looks complicated, but actually it’s a graph” repeats more
often than you’d expect. “People who liked X also liked Y” is a bipartite graph of
users connected to items, and graph operations on it are the bones of a lot of recommendation engines.
Fraud detection looks at clusters and ring patterns in transaction graphs because suspicious activity
tends to look distinctive when you draw it. A Gantt chart is a directed graph in disguise, and the
“critical path” your project manager talks about is the longest path through it. When
npm install grinds for nine minutes and then fails, the package manager has been solving
a constraint problem on a graph of package versions and decided no valid solution exists. Pathfinding
in video games is Dijkstra in a tracksuit.
The thing they have in common is that “graph problem” is almost never written on the tin. The tin says “logistics issue” or “scheduling conflict” or “this query is too slow”. You only spot the graph underneath if you’ve trained yourself to look.
What I actually want you to take away
A lot of the work I do involves systems where things are connected to other things, where some connections matter more than others, and where the way you model those connections decides whether the problem is hard or easy. Most non-trivial systems have a graph hiding somewhere inside them, whether the people building them have noticed or not.
Go back to that cycle detector for a second, because it makes a wider point. Detecting the cycle is the boring half. The interesting move is deciding that your architecture is not allowed to contain one, and then letting the build fail on your behalf when somebody breaks the rule. You take a property you care about, express it as a question about a graph, and hand the checking to a machine that never gets tired or distracted. That is most of what good architecture actually is. The rest is naming things.
Euler’s real trick at Königsberg was the same instinct. He noticed that the bridges, the islands, the river, and the city itself were all incidental. What mattered was how many connections each landmass had. Everything else was scenery, and he had the discipline to ignore it.
So when a problem looks complicated, ask what the vertices are. Ask what the edges are. Ask whether the edges have weights or directions. More often than you’d expect, the answer to “how do we solve this” turns out to be “we don’t, because somebody else already did, in 1736”.
Further Reading
- Reinhard Diestel, Graph Theory — the standard textbook, and free to read on the author’s website.
- Albert-László Barabási, Network Science — the more applied read, also free online.
- P versus NP — if you’ve got a spare decade.